Written by
Chris Hodges
Published
24 March 2023

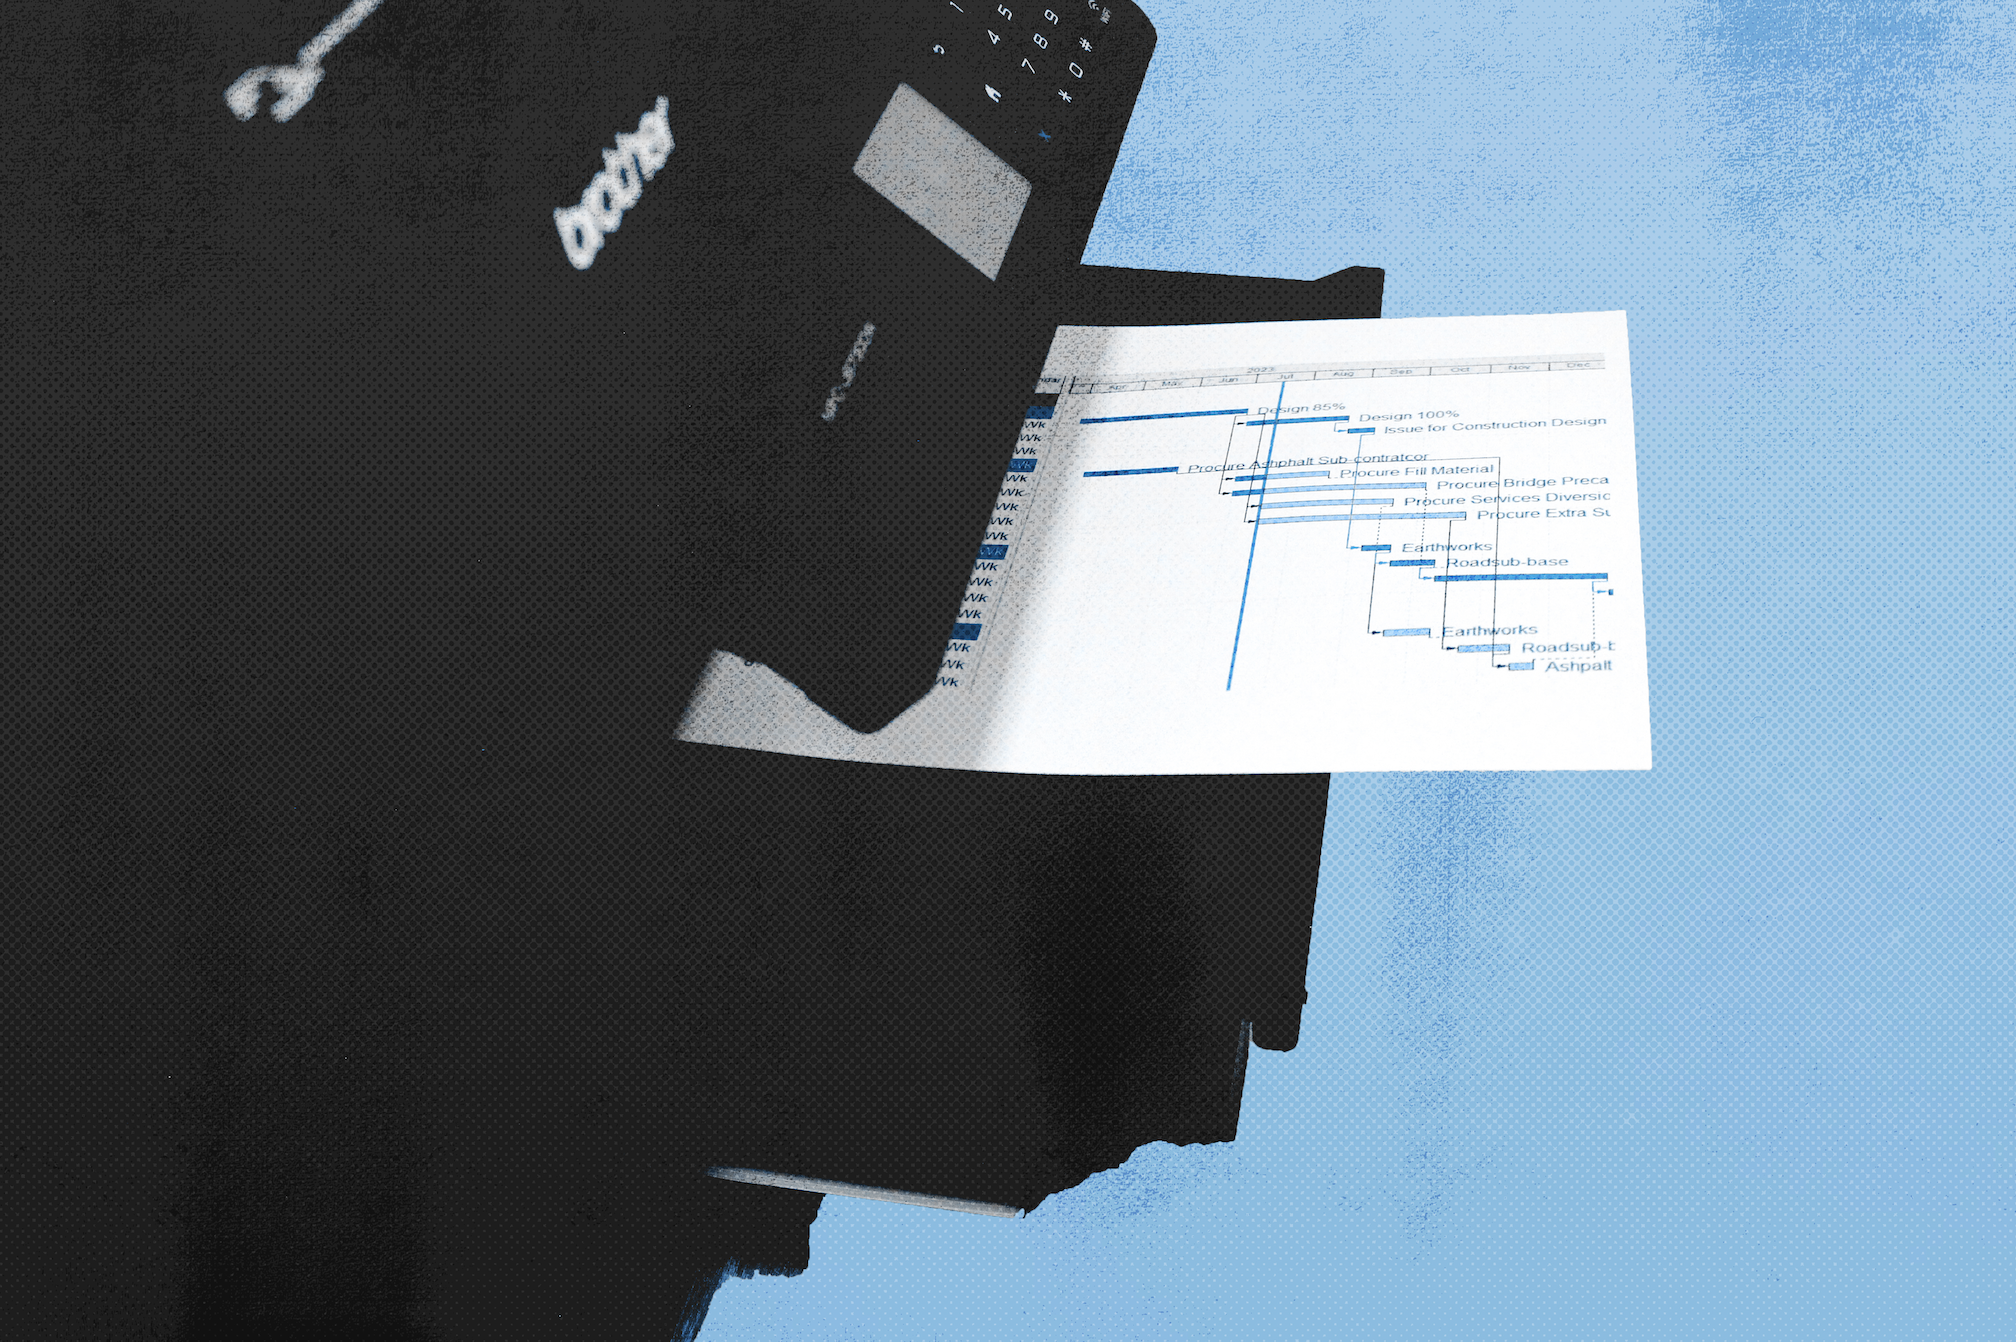
Planning software has long since been the norm on projects. The software is used to produce a baseline or plan and, periodically, an update programme to track progress. Outside of the planning software, the programme can be found attached to a progress report in PDF or paper format. Also, you may find it attached to an extension of time claim or stuck to an office wall.
Primavera P6 planning software is the article’s focus; however, this may also apply to other brands.
So, P6 – very useful, handles lots of data, has its quirks.
This article is about none of that but is about the P6 programme printed to PDF or paper. None of it a quirk, nor a fault in the software. It is more so the limitation of printing from a dynamic to a static environment in a similar way to mapping the earth to flat paper. There are distortions one simply cannot get away from.
The P6 summary durations and graphical representation of the critical path are examples.
Summary Durations
The distortion here is the durations in the summary line do not always equal the activity durations.

Take, for example, the programme extract below:

The construction of Earthworks to Asphalt (Road 1) requires 85 consecutive days. The summary bar shows that the works span 85 days – logical.
The thing to note here, which may not be evident in the printed copy of the programme, is that all these activities have the same calendar, a 5-day, 8-hour-a-day work week.
Changing the calendar, for example, of the Structure (bridge) activity to a 5-day 10-hour-a-day calendar causes the durations to change – as shown in the extract below.
From the extract below, the things to note are the activity duration for Structure (bridge) is now 44 days, whereas it was previously 55 days. The change is because the activity now works 10 hours per day, and thus the task spans fewer days. And most importantly, the summary duration has changed from 85 to 104 despite the construction activities Earthworks to Asphalt (Road 1) being carried out consecutively and across 69 working days:
The reason for the distortion is the software cannot account for different calendars in the roll-up or summary calculation. In this situation, the software reverts to calculate the duration using the Default Calendar, which invariably has a different work week – a 7-day calendar in this example.
The summary duration distortion is present in the Total Float column as well.
Critical Path
The second distortion is the graphical representation of the critical path, the red bars.

The critical path is a sequence of work which, if delayed, will delay completion.
Knowing that the programme is a network of activities is helpful when discussing the critical path. Also, the logic (the arrows in the extracts) between activities establishes the network and sequence of activities, which results in the network’s duration. Within this network is the critical path.
The critical path (or paths) is the longest sequence of activities through the network. The activities on the critical path typically have a zero Total Float duration. Float values in a programme:
“… are an indication of the relative criticality of activities and, generally, when float is exhausted, the completion date will be impacted.”
Activities not on the critical path have float and can be delayed by their float duration before becoming critical.

So, why is this important?
Criticality or Total Float is essentially a way of identifying the most important works…a priority list if you want. The lower the Total Float, the high the priority.
In P6, the critical activities are calculated by setting the Longest Path or Total Float parameters. The example below uses the critical path parameter Total Float equals zero:

Adjusting the critical path parameter for Total Float changes the number of red activities.
For example, the number of red activities increases when the Total Float parameter increases. In the extract below, the Total Float parameter has been set to show activities with less than 15 days of Total Float as red activities. Despite these activities not being the longest sequence of activities through the network. Note the activity’s Total Float values; the newly critical activities have Total Float:

Closing
In short, when using the printed programme, beware of the summary duration where there is no calendar column and the critical activities without a Total Float column.
However, assessing a programme from the printed version is not impossible. In some cases, you may be limited to that. However, using the software allows the hidden parameters to be evaluated, which helps remove programme integrity concerns. Also, the time it takes to assess the programme is significantly reduced, especially for complex programmes.
The above advocates using trained planning professionals. However, more importantly, the often overlooked, meticulous management and archiving of electronic programme copies.
Written by Chris Hodges
Follow us for more!
Get the expert edge
Please add your details below and we’ll be in touch as quickly as possible


